Fimmtudagur, 14. júní 2012
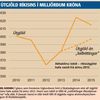
Tölurnar tala sínu máli. Krónan er handónýt.
Gjaldmiðill er notað til að geyma verðmæti. Hér sést það svart á hvítu að krónan er handónýtur gjaldmiðill og ómögulegt fyrir almenning að geyma verðmæti í krónunni.
Sagt var í óðaverðbólgunni að best væri að geyma peningana sína í steinsteypu. Ekki í banka. Því peningarnir fuðruðu upp.
Þetta atriði er lifandi dæmi um að það þarf alltaf fleiri og fleiri verðlausar krónur til þess að kaupa sama verðmætið.
Almenningur er farinn að átta sig á þessari böl og vilja nýjar lausnir. Nýjan gjaldmiðil
Best væri að fá Evru í gegnum ESB aðild.
hvellurinn

|
Hækkaði úr 750 þúsund í 24,9 millj. |
| Tilkynna um óviðeigandi tengingu við frétt | |
Flokkur: Stjórnmál og samfélag | Facebook

Færsluflokkar
Bloggvinir
 ludvikjuliusson
 arinol
 smarg14
 skagstrendingur
 bofs
bofs
 alit
alit
 maeglika
 helgigunnars
 kliddi
 ingagm
 rabelai
 linublogg
 seinars
 svei
svei
| Maí 2024 | ||||||
| S | M | Þ | M | F | F | L |
|---|---|---|---|---|---|---|
| 1 | 2 | 3 | 4 | |||
| 5 | 6 | 7 | 8 | 9 | 10 | 11 |
| 12 | 13 | 14 | 15 | 16 | 17 | 18 |
| 19 | 20 | 21 | 22 | 23 | 24 | 25 |
| 26 | 27 | 28 | 29 | 30 | 31 | |
Nýjustu myndir


Heimsóknir
Flettingar
- Í dag (8.5.): 9
- Sl. sólarhring: 9
- Sl. viku: 25
- Frá upphafi: 690209
Annað
- Innlit í dag: 9
- Innlit sl. viku: 25
- Gestir í dag: 9
- IP-tölur í dag: 3
Uppfært á 3 mín. fresti.
Skýringar
Athugasemdir
Money Supply and Purchasing Power
by Dollardaze aka Mike Hewitt with Krassimir Petrov, PhD.. February 23, 2009
Print1. Introduction
In this paper, we analyze the value of money. We consider both paper money and gold. We attempt to relate the supply of money (MS) and gold to their purchasing power (PP). We demonstrate the extent to which printing of money dilutes its value. As a store of value, the value of money is represented by its purchasing power. We compare the ability of paper money and gold to function as a long-term store of value. We conclusively demonstrate that gold is an excellent store of value, while paper money is not. We observe that excessive printing of paper money is the ultimate cause for the inability of paper money to function appropriately as a store of value.
2. Data Sources
Historical monetary data is readily available on the internet. For the U.S. dollar, the official source is the Federal Reserve Board. It publishes its monetary aggregate data on its web site and makes it available free of charge.
The Bureau of Labor Statistics (BLS) publishes the historical Consumer Price Index (CPI) data. Like the Fed, it also publishes the data on its web site and makes it freely available. For a proxy of the purchasing power of money, we use the inverse of the consumer price index. To illustrate, if the price index doubles, the purchasing power falls in half; if the price index increases 10 times, then purchasing power of money falls 10 times.
3. The Purchasing Power of the USD
The following chart shows together the data taken from the above two sources.
USD - Purchasing Power & Currency in Circulation
The chart visually shows the near-perfect inverse relationship between the amount of money in circulation and its purchasing power. It reflects the simple relationship that prices increase approximately proportionately to money supply. Stated differently, it reflects the basic tenet of monetarism that in the long-run, price inflation is a direct consequence of monetary inflation. It also underlies the classical theory of “money neutrality” whether one believes that money is “neutral” or not is a completely different story.
Looking at the data, from January 1971 to December 2008, the U.S. money supply increased 16.8 times; this was accompanied by an 81.1% drop in purchasing power of the dollar, as implied by the governmentally-reported CPI. Thus, the data suggest that a 17-time increase in money supply has resulted in an approximately five–time fall in purchasing power. We do not attempt to explain this significant gap, but mention that the gap may be due to (1) increases in productivity, (2) over-reported money supply, (3) under-reported CPI, (4) over-valued asset prices (stocks, bonds, real estate), or possibly (5) a fundamental flaw in the quantity theory of money. We would suggest, in order of significance, (3), (4), and (1) as the most important factors explaining the gap.
4. The Purchasing Power of Other Major Currencies
The United States is not alone in pursuing inflationary monetary policy and steadily inflating its money supply. Available historical exchange rate and money supply data permit similar analyses for other major currencies. We provide a similar analysis for (1) the British Pound, (2) the Canadian Dollar, (3) the Australian Dollar, (4) the Japanese Yen, and (5) the Swiss Franc for the same period (1971-2008).
We chose 1971 as a starting point for three reasons. First, prior to 1971 exchange rates were fixed, Second, pre-1971 exchange rate data is difficult to obtain. Finally, prior to 1971 the dollar was fixed (convertible) to gold. On the other hand, after 1971, exchange rates were floating, data are available, and the dollar floated against gold.
In other words, we chose the post-Bretton-Woods period. Bretton Woods is the period that characterizes the international monetary regime between WWII and 1971. After the Second World War, only the U.S. Dollar remained convertible to gold at a rate of US$35 per troy ounce. During that period all other currencies were linked to the dollar at a fixed exchange rate. On August 15, 1971, President Nixon unilaterally closed the ‘gold window’ to prevent foreigners from exchanging their U.S. Dollars for gold.1 Thus, he terminated the convertibility of the dollar to gold and allowed the dollar to float against gold. This was done likely to prevent the complete loss of the U.S. gold reserves. In turn, other currencies began to float against the U.S. dollar. Since that historic moment, for nearly 38 years all currencies in the world have not been backed by any tangible asset. It is an unprecedented monetary experiment that extends to the entire world and involves every living person.
The next three charts show similar relationships for the British Pound, The Canadian Dollar, and the Australian Dollar.
GBP - Purchasing Power & Currency in Circulation
CAD - Purchasing Power & Currency in Circulation
AUD - Purchasing Power & Currency in Circulation
Iinterestingly enough, the remaining two currencies – the Japanese Yen and the Swiss Franc – displayed greater resilency to monetary inflation and depreciation. This is especially true for the Swiss Franc – the amount of Swiss Francs in circulation increased a relatively modest 280% over the same period. The explanation may lie in the fact that even though the Swiss Franc has not been technically (legally) convertible to gold, the Swiss Central Bank has attempted to maintain proper gold backing of the Franc, which in turn, had the effect of moderating monetary expansion.
JPY - Purchasing Power & Currency in Circulation
CHF - Purchasing Power & Currency in Circulation
5. The Purchasing Power of Gold
Before 1971, gold was always used as a basis for money. It is generally accepted that gold has functioned well as a store of value and has maintained well its purchasing power for over 5000 years. So, what can we say about the supply of gold and its purchasing power for the period of 1971-2008? How does gold compare as a store of value (purchasing power) against other major currencies for the same period?
For the supply of gold, we use data from the U.S. Geological Survey (USGS) and the World Gold Council (WGC). USGS maintains records of supply-demand statistics for a variety of minerals and metals, including gold, going back to 1900. The WGC estimates that a total of 165,547 tonnes of gold have been mined, including 2,400 metric tonnes for 2008. Combining the two data sets, we infer that for the period of 1971-2008, gold supply increased from 93,515 metric tonnes of gold to 165,948; thus, for the whole period, gold supply increased by merely 78%.
For the same period and using the same CPI statistics, the purchasing power of gold has actually increased four times. The price of gold is up from about $38 to about $822, which corresponds to an increase in its price of almost 22 times, while the CPI is up from about 40 to 210, or about 5 times. Thus, for the period, the price of gold has increased about 22 times, while the price level has increased about five times, resulting in an increase in the purchasing power of gold of about four times; the exact increase is 310%, which corresponds to purchasing power of a little over four times. The numbers are shown on the graph below.
Gold - Purchasing Power & Amount Mined
Conclusion
So, what can we conclude from this whole analysis? The overall conclusion is that gold is a significantly better store of value than paper currencies. While the purchasing power of gold is up four times, the purchasing power of major currencies is down 5-10 times, except for the Swiss Franc and the Japanese Yen, whose depreciation is significantly less. The second column in the table below, Change in Unit Value, shows the exact percentages.
Fold-
Increase
Unit Value (%)
The explanation for gold’s ability to hold its purchasing power becomes obvious from the first column. While the supply of gold has not even doubled for the period, the supply of some currencies has increased 10-20-30 times and more. For example, the supply of Australian dollars increased 33.5 times, while the supply of Canadian Dollars is up 15.4 times. There should be no wonder why they have lost most of their value for the period. If governments print them fast, they will depreciate rapidly – it is as simple as that. Governments can’t print gold, so they can’t depreciate its value. In the world of money, gold is still the best store of value.
© 2009 Dollardaze & Krassimir Petrov, Ph.D.
Resources
[1] It was illegal for Americans to own gold for investment purposes since President Roosevelt signed Executive Order 6102 on April 5, 1933. It wasn't until Dec 31, 1974 when Americans could own once again own gold coins, bars and certificates.
Related Editorials
Mike Hewitt is the editor of Dollar Daze, a website pertaining to commentary on the instability of the global fiat monetary system and investment strategies on mining companies. His website also provides a no-cost market data feed service with up-to-date quotes on currency exchange rates, commodity prices and major indices.
Contact Information
Mike Hewitt | Editor, Dollar Daze | Mississauaga, Ontario, Canada | Email
Eggert Sigurbergsson, 14.6.2012 kl. 14:44
Krónan er alls ekki ónýt. Það er stjórnun efnahagsmála í þessu hagkerfi okkar sem er ónýt. Gengi krónunnar endurspeglar bara stjórn efnahagsmála.
KIP (IP-tala skráð) 14.6.2012 kl. 15:52
Rétt er að stjórn efnahagsmála spilar inn í hræðilegu ferilskrá krónunnanr.
kv
sleggjan (IP-tala skráð) 18.6.2012 kl. 15:18
Bæta við athugasemd [Innskráning]
Ekki er lengur hægt að skrifa athugasemdir við færsluna, þar sem tímamörk á athugasemdir eru liðin.